MPUG June Meetup: Interactive Visualization in Python
So it was the first Monday of the month. I didn’t realize it until Ed posted on the mailing list. Melbourne Python User Group meets every first Monday of the month (except January). I read Ed’s email at 3.30 PM and I still need to catch the train to city.
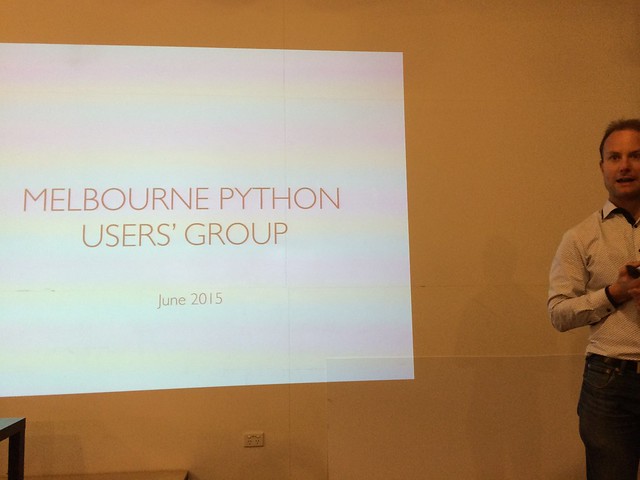
Luckily, I could made it on time. So I helped with arranging seats. Soon, Ed started his talk. Ed gave introduction about what’s MPUG, what’s new in Python, the next PyCon AU including the financial assistance, and also let the attendees introduced themselves.
Visualization. It’s an interesting topic for me although I don’t have the chance on visualizing anything yet. Ed started with d3.js a javascript library. Since d3js is for web page, how we visualize in Python? Then Ed shared on matplotlib. Ed showed the rubix cube game which created using Python. It was written with around 400 lines of code. Then mpld3 which stands for matplotlib to d3.
I recorded a 10 seconds video, interactive visualization in IPython notebook. My favourite was the spectrogram visualization, but too bad I didn’t record it. One of the attendees asked where the sound input comes from. Ed answered it was processed using pyaudio library. Since google hangout receives audio input from the browser, it might be a good idea to try audio input from the browser.
The last library that Ed mentioned was the bokeh library.
There were only around 10 people who attended the meetup. Probably it was because the first day of winter. But after all, it was a nice meetup!